Why the FANGs could bite into your portfolio
June 20, 2018
Redpoint Investment Management
ABOUT REDPOINT Redpoint Investment Management Pty Ltd (Redpoint) is a boutique global equities manager headquartered in Sydney, Australia. Redpoint specialises in listed equity investments and manages in excess of $10bn for institutional and retail clients. Redpoint is also the investment manager of the Redpoint Global Infrastructure Fund issued by responsible entity, Antares Capital Partners Limited.
There is much investor interest in the so-called FANGs: Facebook, Amazon, Netflix and Google, and the rest of the ‘internet-based’ companies. But while their popularity continues to grow there are reasons to be cautious about their ability to continue to deliver solid returns for investors.
Investors have no doubt heard of, or had some exposure to the FANGs. These are the largest and most well-known companies in a group which really includes any company with a predominately internet-based service delivery model. While these companies continue to grow strongly, currently with very expensive valuations, we don’t have to look too far back to find an example where something similar has happened before.
Chart 1: Performance of the S&P 500 Index – Index vs IT sector
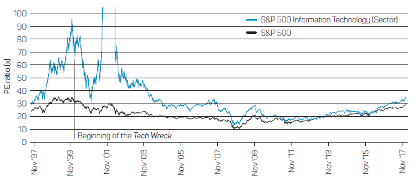
Source: S&P Global Market Intelligence and Redpoint, as at 31 January 2018. Past performance is not indicative of future performance.
Note: we have trimmed the extreme data outliers as they reduce the graph’s meaningfulness.
The ‘Tech Wreck’ lesson
In March 2000, the Technology, Media and Telecoms (TMT) bubble burst. The Information Technology (IT) Sector comprising many of these stocks was trading at a previously unseen price-earnings (PE) ratio of 95.2x. In contrast, on 27 March 2000, the S&P 500 Index was trading at a PE ratio of 34.6x. To understand how spectacularly expensive a PE ratio of 95.2x is, consider buying an investment property, for say $500,000 and receiving only $5,252 rent for the year. That’s about $100 a week. (95.2 x $5,252 = $500,000).
So how could you justify this valuation? Maybe, you purchased the property in a hot new area of town, you expect high demand in the future, and expect the rental income to grow strongly? You know you’ll need to renovate the property over time, the kitchen and bathroom will need upgrades, new carpets, painting, etc. You can see most of your rental income getting reinvested.
The danger is, if the demand doesn’t materialise to the extent you forecast, or other cheaper, more modern properties become available, or the property needs even more reinvestment than expected, then your property is going to trade lower, perhaps much lower. In short, there is little margin for error. For TMT stocks all three of these things happened.
What can we learn about a ‘technology bubble’ from historical PE valuations?
By looking at historical PE valuations we can identify the following three characteristics of technology-related bubbles.
The first is, it is hard to predict when the correction will occur. The IT sector traded at ever higher multiples for several years prior to the major correction. There were some drawdowns, but euphoria in the prospective returns offered by early adopters of the internet pushed prices higher.
The second important fact is that the correction actually took some years to fully run its course. There was an initial sell-off of TMT stocks and the market more broadly, then there were the write-downs and the economic slowdown, eventually there were the bankruptcies.
The third fact is that it took twelve years for the IT sector’s valuation to match the market. It wasn’t until January 2013 that both valuations matched at a PE ratio of 17.6x.
You could argue the market was right in March 2000. The IT sector did offer an enormous growth opportunity which you would expect to pay a premium for. What the market got wrong was how much of a premium to pay.
Chart 2 – Largest constituents of the internet software and services and internet and direct marketing retail industries
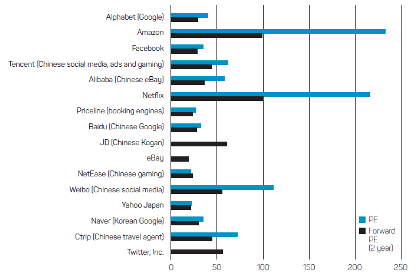
Source: S&P Global Market Intelligence and Redpoint, as at 31 January 2018. Past performance is not indicative of future performance.
Be wary of the FANGs
Today, we are looking at a similar situation, the S&P 500 Index is trading at a PE ratio of 30.2x (34.6x in March 2000), but we need to look deeper into industries to see those companies trading at eye-watering premiums to earnings.
Chart 2 shows the PE and forward PE ratios of the largest constituents of the Internet Software & Services and Internet and Direct Marketing Retail industries, which includes the ‘FANGs’. The forward PE ratio is measured as current price relative to the consensus earnings forecast for 2019. The chart is sorted from largest company to smallest company by market capitalisation.
With the exception of eBay, PE valuations for these companies range from high (twenty-something), very high (thirty-something) to extreme (forty-something+). Supposing there is no share price growth in the spectacularly expensive Amazon and Netflix, then these are forecast to reach reasonable valuations in about 10 years time. If there is share price growth, which most investors would hope for, then it is likely to take longer to reach reasonable valuations. Netflix is as large as Commonwealth Bank, the largest Australian company. The currently loss-making Twitter, is as large as Transurban Group, and is expected to reach a reasonable PE ratio in five years, again assuming no share price growth.
To give an appreciation of scale of these internet companies, they have a combined market capitalisation roughly the size of the UK share market.
Viewing these valuations another way, Chart 3 shows the PE ratios of the NASDAQ Internet (QNET) Index, against the S&P 500 Index. The QNET Index includes 84 internet technology companies trading in the United States. Internet stocks had, in totality, negative earnings for much of the early part of the 2000s, so a PE ratio doesn’t make sense and isn’t displayed.
Chart 3 – NASDAQ Internet (Qnet) Index relative to the S&P 500 Index
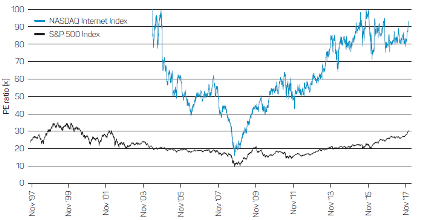
Source: S&P Global Market Intelligence and Redpoint, as at 31 January 2018. Past performance is not indicative of future performance.
Note: we have trimmed the extreme data outliers as they reduce the graph’s meaningfulness.
Once bitten, twice shy
At a current PE ratio of 93.1x the NASDAQ Internet Index is looking much like the IT sector in March 2000. Whether the internet sector suffers (another) tech wreck, rises from here, or flattens is unknowable. One thing is certain though, the sector appears very expensive. While investors should be looking towards sectors which are driving innovation and growth like internet-based companies, they should also take into account past lessons and their individual circumstances before deciding to commit to ensure they don’t end up being bitten where it can hurt most; their wealth.
Please contact us on |PHONE| if we can be of assistance .
Source : Nab assetmenagement June 2018
Important information
This publication is provided by nabInvest Capital Partners Pty Limited (ABN 44 106 427 472, AFSL 308953) (‘NCP’) as service provider of Antares Capital Partners Limited (ABN 85 066 081 114, AFSL 234483) (‘ACP’), responsible entity of the Redpoint Global Infrastructure Fund (ARSN 155 123 032, APIR code PPL0031AU, ASX mFund code RPO01) (‘Fund’) and Navigator Australia Limited (ABN 45 006 302 987, AFSL 236466) (‘NAL’) as responsible entity of the Separately Managed Account (ARSN 138 086 889) (‘SMA’). Redpoint Investment Management Pty Limited (‘Redpoint’) has been appointed by ACP as investment manager of the Fund, and by NAL as investment manager for the Redpoint Industrials Model Portfolio on the SMA. Before making any decision about investment in the Fund or the SMA, you should consider the product disclosure statement (‘PDS’) of the Fund available from nabam.com.au/rgif or by calling 1300 738 355 and the PDS of the SMA available from mlc.com.au/forms_and_brochures or by calling 132 652 or by speaking with your financial adviser.
NCP, ACP and NAL are members of the group of companies comprised National Australia Bank Limited (ABN 12 004 044 937, AFSL 230686), its related companies, associated entities and any officer, employee, agent, adviser or contractor therefore (‘NAB Group’). Any references to “we” include members of the NAB Group. An investment in any product or service referred to in this publication does not represent a deposit or liability of, and is not guaranteed by NAB or any other member of the NAB Group.
The information in this publication has been provided to us by Redpoint, it comprises their opinion and judgment at the time of issue and are subject to change. We believe that the information herein is correct and reasonably held at the time of compilation. However, neither NCP nor any member of the NAB Group, nor their employees or directors give any warranty of accuracy or accept any responsibility for errors or omissions in this publication. Where information contained herein includes information obtained from third parties, we believe to the best of our knowledge, necessary consents have been obtained.
Any reference in this publication to a specific company is for illustrative purposes only and should not be taken as a recommendation to buy, sell or hold securities or any other investment in that company. The Fund or SMA may not hold securities of, or any other investment in, any company mentioned in this publication before, at or after the time of publication.
Past performance is not a reliable indicator of future performance. The value of an investment may rise or fall with the changes in the market. Any projection or other forward looking statement in this publication is provided for information purposes only. Though reasonably formed, no representation is made as to the accuracy of any such projection or that it will be met. Actual events may vary materially.
This publication may constitute general advice. It has been prepared without taking account of your objectives, financial situation or needs and because of that you should, before acting on the advice, consider the appropriateness of the advice having regard to your personal objectives, financial situation and needs.
This publication is directed to and prepared for Australian residents only.
Powered by WPeMatico