THE AGE OF THE SUPERCOMPANIES
November 13, 2017
Mike Gallagher, CFA, CAIA, Head of Distribution, Intermede Investment Partners
American corporations are enjoying a golden age of profitability. Intermede examines the sources of their current relative dominance and the potential risks faced by some of the technology businesses that currently sit at the top of the pile.
A March 2016 article in The Economist argued that the process through which the level of corporate profitability typically mean-reverts appeared to be broken in the United States1
High profits typically attract new entrants to a sector, after which increased competition dilutes these supernormal returns. Discouraged investor capital then heads for the exits, planting the seed for the cycle to begin again.
An observation from consulting firm McKinsey supports the view that US firms have bucked this trend in recent years: “An American firm that was very profitable (one with post tax returns on capital of 15-25%) in 2003, stood an 83% chance of still being very profitable in 2013 … In the previous decade, the odds were about 50%”.
The proposed causes of this sustained corporate dominance included increased consolidation (the number of listed firms in the US has halved in the last 20 years), as well as an increased level of concentration within industries.
An outcome of the above shifts (to which we would add as additional causes, the decreased bargaining power of labour, and a declining corporate tax burden) has been a leap in profitability. Cash flow return on investments for US companies has gone from an average of approximately 5.5% (1976-1996) to closer to 9% (1997-2016).2
Clearly then, this has been a good period for US corporations. At the forefront of this trend have been the small set of mega cap technology businesses (“supercompanies”) that have risen to dominance in recent years, as reflected in Chart 1.
Chart 1: Supercompany dominance in recent years
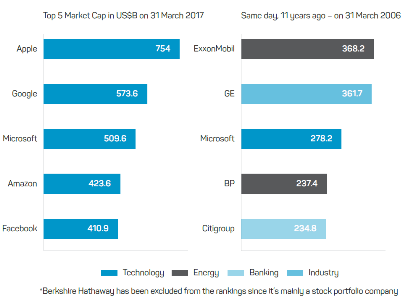
Source: ‘The profound implications of five increasingly dominant tech companies’, medium.com, accessed 26 September 2017.
As investors, how should we view this trend?
A period of peak optimism with respect to the operating prospects of a business can coincide with a heightened level of investment risk, if this positive sentiment leads the market to place an excessive valuation on the future earnings stream of the company. It is therefore important to seek correctives when times are good. One arguably reliable behavioral guardrail can be found by reviewing the mixed history of technology investing.
Why do things go wrong?
In a widely-circulated recent client memo,3 Oaktree’s Howard Marks listed the risks that can deflate technooptimism: an unforeseen change in environment; the emergence of a hidden flaw in a young business model; excellence in concept being undercut by weakening execution; or (perhaps most commonly) extreme overpricing of decent fundamentals subsequently resulting in destruction of investor wealth.
Our favourite encapsulation of irrational valuation dynamics came from Scott McNealy, the ex-Chairman of Sun Microsystems, from a 2002 interview reflecting on the way in which the market priced his company at the dotcom peak:
“Two years ago we were selling at 10 times revenues when we were at $64. At 10 times revenues, to give you a 10-year payback, I have to pay you 100% of revenues for 10 straight years in dividends. That assumes I can get that by my shareholders. That assumes I have zero cost of goods sold, which is very hard for a computer company. That assumes zero expenses, which is really hard with 39,000 employees. That assumes I pay no taxes, which is also very hard. And that assumes you pay no taxes on your dividends, which is kind of illegal. And that assumes that with zero R&D for the next 10 years, I can maintain the current revenue run rate. Now, having done that, would any of you like to buy my stock at $64? Do you realise how ridiculous those basic assumptions are?”4
Thankfully, valuations for today’s tech companies are somewhat more reasonable. Chart 2 shows the extent to which current technology market capitalisation is supported by profits this time around:
Chart 2: Tech renaissance
World technology stocks price and earnings, 1996 – 2017
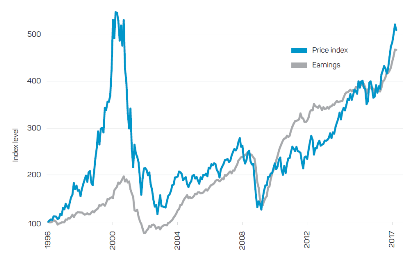
Sources: BlackRock Investment Institute, with data from MSCI and Thomson Reuters, July 2017. Notes: the price index is based on the MSCI All-Country World Technology Index. Earnings are represented by the aggregate 12-month forward earnings estimate. Both series are rebased to 100 at the start of 1996.
So where are the dangers for this set of supercompanies?
Given the near-duopoly position of current portfolio holdings Facebook and Google in the online advertising market (it was widely reported in May 2017 that the two companies are currently capturing almost 100% of the growth in online advertising spend5) one area we are carefully considering is the potential risk of antitrust action. The recent €2.4 billion fine imposed on Google by the EU Competition Commission6 for exploiting its dominance in search is a salient reminder of the need for vigilance.
But, it is also important we do not let our inner pessimist blind us to the extraordinary (and still-strengthening) competitive positions held by these businesses. In October 2012, when Facebook hit 1 billion users, 55% used the service daily. When Mark Zuckerberg announced in June 2017 that the 2 billion milestone had been reached, the fraction of daily users had increased, remarkably, to 66%.7 The next most popular service on the web, YouTube, with 1.5 billion regular users, is owned by Google.8
The continued strong growth in earnings and cash flows being generated by both businesses speaks eloquently of their extraordinary ability to monetise human attention.
For now at least, we believe, it appears to be the age of the supercompanies.
Source : nabassetmanagement October 2017
1. ‘Too much of a good thing’, The Economist, 26 March 2017.
2. US Industrial firms weighted by net assets, Credit Suisse, MSCI.
3. ‘There they go again… again’, Marks H, Oaktree Capital Management, L.P, 26 July 2017.
4. ‘Scott McNealy on the bubble’, Scott McNealy, Nyquist Capital, accessed 26 September 2017.
5. ‘How Google and Facebook have taken over the digital ad industry’, Ingram M, Fortune, 5 January 2017.
6. European Commission – Press release, Brussels, 27 June 2017.
7. ‘Two billion people coming together on Facebook’, Facebook newsroom, 27 June 2017.
8. ‘YouTube has 1.5 billion logged-in monthly users watching a ton of mobile video’, techcrunch.com, 22 June 2017.
Important information
This publication is provided by Antares Capital Partners Limited (ABN 85 066 081 114, AFSL 234483) (ACP) a member of the group of companies comprised National Australia Bank Limited (ABN 12 004 044 937, AFSL 230686), its related companies, associated entities and any officer, employee, agent, adviser or contractor therefore (‘NAB Group’). Any references to “we” include members of the NAB Group. An investment in any product or service referred to in this publication does not represent a deposit or liability of, and is not guaranteed by NAB or any other member of the NAB Group.
This information may constitute general advice. It has been prepared without taking account your objectives, financial situation or needs and because of that you should, before acting on the advice, consider the appropriateness of the advice having regard to your personal objectives, financial situation and needs.
Past performance is not a reliable indicator of future performance. The value of an investment may rise or fall with the changes in the market. Any opinions expressed in this publication constitute our judgement at the time of issue and are subject to change. Neither ACP nor any member of the NAB Group, nor their employees or directors give any warranty of accuracy, not accept any responsibility for errors or omissions in this publication.
Any projection or other forward looking statement (‘Projection’) in this document is provided for information purposes only. No representation is made as to the accuracy of any such Projection or that it will be met. Actual events may vary materially.
This information is directed to and prepared for Australian residents only.
The funds referred to herein are not sponsored, endorsed, or promoted by MSCI, and MSCI bears no liability with respect to any such fund.
ACP may use the services of NAB Group companies where it makes good business sense to do so and will benefit customers. Amounts paid for these services are always negotiated on an arm’s length basis.
Important: Any information provided by the author detailed above is separate and external to our business and our Licensee. Neither our business, nor our Licensee take any responsibility for any action or any service provided by the author. Any links have been provided with permission for information purposes only and will take you to external websites, which are not connected to our company in any way. Note: Our company does not endorse and is not responsible for the accuracy of the contents/information contained within the linked site(s) accessible from this page.
Powered by WPeMatico