Measuring fear and greed on wall street
April 30, 2018
April 2018
Bob Cunneen, Senior Economist and Portfolio Specialist, NAB Asset Management
“Investors should remember that excitement and expenses are their enemies. And if they insist on trying to time their participation in equities, they should try to be fearful when others are greedy and greedy only when others are fearful”
– Warren Buffett, 2004 annual letter to shareholders
What are fear and greed and what do they mean if you’re an investor?
Instinctively we know what fear and greed are. Imagine you are at a family dinner. Fear is the alarm that you will have to eat the meal even though it tastes like poison. Fear is the perception of danger. You ‘fear’ that your investment portfolio is giving such large losses that this will result in a permanent loss of wealth. Fear makes you want to get out of your investment.
Greed is the polar opposite. Greed is the endless scoops of gravy being delivered to your plate by high positive returns. Greed is where you are so consumed with your rising wealth that you go back for seconds. With greed, you are willing to increase the amount of risky assets in your portfolio in a ravenous desire for wealth.
Can we measure how much fear and greed are impacting share prices today?
Fear and greed are extreme emotions. Just like the emotions of happiness or sadness, there is no single precise calculation for measuring fear and greed.
However, we can try to capture investor sentiment. This looks at how investors act and feel about changes in the share market. This can go some way to measuring fear and greed.
Let’s look at three different measures which together form a ‘sentiment gauge’. These are confidence, concerns and conviction.
We will concentrate on US shares because this is the largest market in the world with the widest number of indicators.
1. Confidence
There are a smorgasbord of US surveys which aim to measure confidence. These surveys include the American Association of Individual Investors as well as the Michigan and Yale University surveys. Typically investors are asked a series of questions on whether they are bullish and optimistic, or whether they are bearish and pessimistic.
These responses are scored over time to give a track record of their performance. There are two notable concerns with these surveys. Firstly, there may be a gap between the survey response and investors’ actual beliefs. An investor may wish to camouflage their beliefs. Secondly, these surveys can be noisy, swinging wildly between optimism and pessimism given impulsive whims or dramatic recent events. Hence there are doubts whether these surveys actually provide a helpful signal or just confusion.
This is shown in Chart 1 below which tracks confidence, using the Sentix investor survey, against the share market (S&P 500 Index).
Chart 1: Investor confidence is tracking US share prices, and both are currently very high
US shares vs confidence
Past performance is not a reliable indicator of future performance.
Source: Federal Reserve St Louis, February 2018.
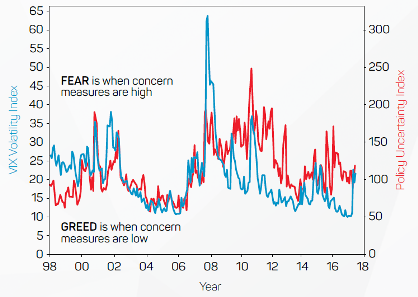
2. Concerns
The level of concern about share markets tends to be measured by the VIX index, renowned in financial markets as the ‘fear gauge’. The VIX measures market expectations of near-term volatility as conveyed by share option prices. In times of dramatic events such as the September 2001 terrorist attacks or intense financial market stress (Global Financial Crisis 2007-09), the VIX index has dramatically spiked, showing fear.
Another US index, the Policy Uncertainty Index, also has a habit of surging higher when political and economic concerns are perceived by the media. This index measures the frequency of newspaper articles containing words such as ‘economy’, ‘uncertainty’, ‘politics’, ‘Congress’ and ‘White House’.
Combining the VIX and Policy Uncertainty indices provide a good insight into investor concerns. This provides us a feel for fear and greed levels – shown below in Chart 2. When concerns are very high, fear is evident in the market. When concerns are very low, greed is more likely apparent.
Chart 2: Volatility, economic and political uncertainty: investor concerns are currently low
Concern measures: VIX and Policy Uncertainty Index
Past performance is not a reliable indicator of future performance.
Source: Federal Reserve St Louis, March 2018.
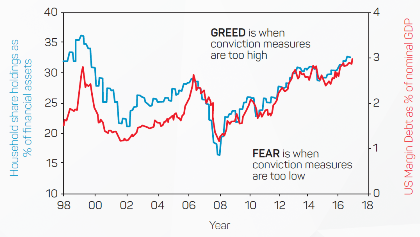
3. Conviction
Investors’ conviction or belief in the share market can be measured by their exposure to shares and the scale of their debt. The Federal Reserve’s ‘Flow of Funds’ survey shows household shares exposure as a percentage of financial assets. Notably at the peak of the dot.com era in March 2000 (a ‘greed’ episode), US households had 36% of their financial assets in shares. This slumped to only 21% by March 2003 after the NASDAQ technology crash and the Enron and WorldCom accounting scandals (a ‘fear’ episode).
Margin debt is the additional borrowing of money to finance holding shares. Historically, margin debt has showed a pattern of rapid credit borrowing during share booms such as 2000 and 2007 (greed) only to collapse towards fear (2003, 2009). Investor conviction is shown in Chart 3.
Chart 3: Investor conviction is relatively high
Conviction measures: share exposures as a % of financial assets and US margin debt
Past performance is not a reliable indicator of future performance.
Source: Federal Reserve St Louis, February 2018.
So as investors, how can we best understand the level of fear or greed in the market at any given time? While there are many measures, each with its advantages and limitations, there is no consistent, single indicator. However, by combining the three measures discussed into one sentiment gauge, we can capture the historical extremes of fear and greed. See Chart 4 below.
Chart 4: The sentiment gauge on US shares is currently very high
US shares vs sentiment gauge
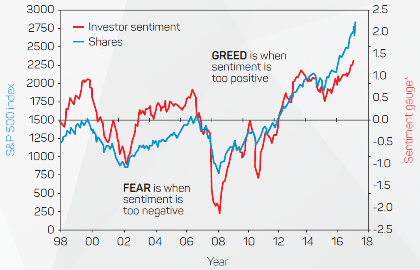
* Sentiment gauge based on VIX volatility, Household share holdings, Sentix investor survey, Margin Debt and Policy Uncertainty Index
Past performance is not a reliable indicator of future performance.
Source: Federal Reserve St Louis, February 2018.
So where are we now in early 2018 on the sentiment gauge?
America’s S&P 500 Index rose by 21% in 2017 (Chart 4, blue line) and Wall Street seems to be in the ”greedy” phase according to the red line, the sentiment gauge. Indeed the sentiment reading now exceeds the high greed levels of 2000 and 2007 when the US share market peaked.
When sentiment is this positive on US shares, this shows evidence of irrational greed in the market. Warren Buffet’s wise adage “to be fearful when others are greedy” is a warning sign for investors.
1 ‘Expectations of returns and expected returns’, NBER working paper series, January 2013, p.2-3. © 2013 by Robin Greenwood and Andrei Shleifer.
Source : NAB assetmanagement April 2018
Important Information
This communication is provided by MLC Investments Limited (ABN 30 002 641 661, AFSL 230705) (“MLC”), a member of the National Australia Bank Limited (ABN 12 004 044 937, AFSL 230686) group of companies (“NAB Group”), 105–153 Miller Street, North Sydney 2060. An investment with MLC does not represent a deposit or liability of, and is not guaranteed by, the NAB Group. The information in this communication may constitute general advice. It has been prepared without taking account of individual objectives, financial situation or needs and because of that you should, before acting on the advice, consider the appropriateness of the advice having regard to your personal objectives, financial situation and needs. MLC believes that the information contained in this communication is correct and that any estimates, opinions, conclusions or recommendations are reasonably held or made as at the time of compilation. However, no warranty is made as to the accuracy or reliability of this information (which may change without notice). MLC relies on third parties to provide certain information and is not responsible for its accuracy, nor is MLC liable for any loss arising from a person relying on information provided by third parties. Past performance is not a reliable indicator of future performance. This information is directed to and prepared for Australian residents only. MLC may use the services of NAB Group companies where it makes good business sense to do so and will benefit customers. Amounts paid for these services are always negotiated on an arm’s length basis.
Powered by WPeMatico