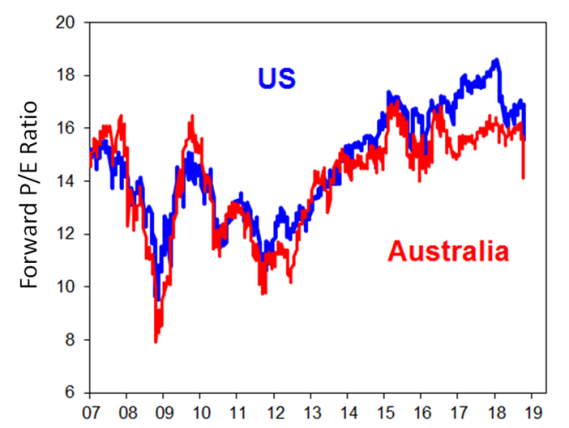
Chart of the week: Wall street moves from ‘perfection’ to ‘correction’
November 2, 2018
1 November 2018
Bob Cunneen, Senior Economist and Portfolio Specialist
Forward Price to Earnings Ratio 1 year
Source: FactSet and Institutional Brokers’ Estimate System (IBES)
Wall Street’s golden run in terms of a rising share market seems to have come to an end in recent weeks. After reaching a historic peak of 2,931 in September, the benchmark S&P 500 index has fallen nearly 10%. There is a ‘check list’ of concerns that has driven Wall Street’s sharp reversal in October such as higher US bond yields, the escalating trade war between the US and China, Emerging Market stress, Italy’s contentious budget stimulus proposals as well as greater global regulatory scrutiny and taxation of technology companies.
However one key reason for this sharp selloff is that US shares were priced for perfection and vulnerable to any disappointment. US shares had a very high Forward Price to Earnings (P/E) ratio of 17 in September (blue line). Even with expectations that US profits would increase a further 10% in 2019 after the 20% forecast growth for this year, the S&P 500 was ambitiously priced for the ‘best of all possible worlds’. Arguably US shares have come back to reality with October’s price slide. The US Forward P/E was 15.5 as at 26 October according to FactSet and is now much closer to the past decade’s average of 14.5.
For all global share markets, there is nowhere to hide when Wall Street finds reverse gear. Even Australia with a more moderately priced Forward P/E has also suffered in October (red line). Global investors will probably need to see a convincing armistice for the trade war and more stable US bond yields before again pricing Wall Street for perfection.
Source : Nab assetmanagement November 2018
Important Information
This communication is provided by MLC Investments Limited (ABN 30 002 641 661, AFSL 230705) (“MLC”), a member of the National Australia Bank Limited (ABN 12 004 044 937, AFSL 230686) group of companies (“NAB Group”), 105–153 Miller Street, North Sydney 2060. An investment with MLC does not represent a deposit or liability of, and is not guaranteed by, the NAB Group. The information in this communication may constitute general advice. It has been prepared without taking account of individual objectives, financial situation or needs and because of that you should, before acting on the advice, consider the appropriateness of the advice having regard to your personal objectives, financial situation and needs. MLC believes that the information contained in this communication is correct and that any estimates, opinions, conclusions or recommendations are reasonably held or made as at the time of compilation. However, no warranty is made as to the accuracy or reliability of this information (which may change without notice). MLC relies on third parties to provide certain information and is not responsible for its accuracy, nor is MLC liable for any loss arising from a person relying on information provided by third parties. Past performance is not a reliable indicator of future performance. This information is directed to and prepared for Australian residents only. MLC may use the services of NAB Group companies where it makes good business sense to do so and will benefit customers. Amounts paid for these services are always negotiated on an arm’s length basis.
Powered by WPeMatico
