Chart of the week: China’s Great Wall against Trump’s trade war
September 21, 2018
20 September 2018
Bob Cunneen, Senior Economist and Portfolio Specialist
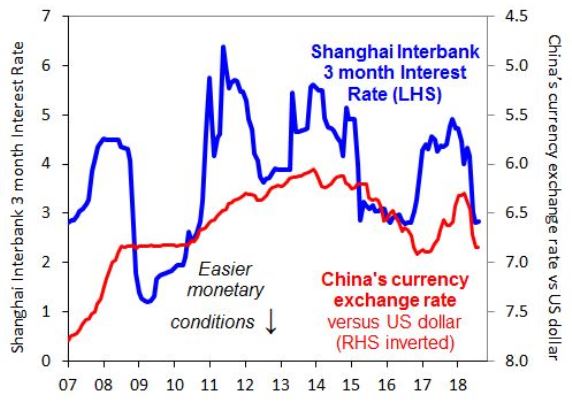
China’s monetary condition indicators
Source: Federal Reserve Bank of St Louis and Reuters Datastream
President Trump has just confirmed another 10% tariff on US$200 billion in imported goods from China. This is the second round of ‘Trump’s trade war’ following the earlier 25% tariff on US$50 billion on Chinese imports. So President Trump has effectively escalated the conflict since the bold Twitter tweet that “trade wars are good and easy to win”.
China’s tariff response has been more modest. China has imposed tariffs on US imports totalling only US$110 billion. China’s restraint in applying equivalent tariffs may reflect a number of factors. China imported only US$130 billion in goods from the US in 2017, so is running out of goods to apply tariffs to. China also wishes to negotiate an early end to this trade war given the downside risk to their economy. A trade war could lower China’s economic growth by up to 1% by penalising exports and damaging investment.
Where China has been more active in defending their economy is by providing easier monetary conditions. China’s central bank has assertively added cash to the financial system which has lowered interbank interest rates from 4% to 2.6% since May (blue line). This should eventually lead to lower interest rates for businesses and households. China has also guided the Chinese currency to fall by 7% against the US dollar (red line). This should help Chinese exports to stay price competitive. Both of these Chinese monetary measures are critical parts of the Great Wall’s defence against President Trump’s trade threat.
Source : Nab assestmanagement September 2018
Important Information
This communication is provided by MLC Investments Limited (ABN 30 002 641 661, AFSL 230705) (“MLC”), a member of the National Australia Bank Limited (ABN 12 004 044 937, AFSL 230686) group of companies (“NAB Group”), 105–153 Miller Street, North Sydney 2060. An investment with MLC does not represent a deposit or liability of, and is not guaranteed by, the NAB Group. The information in this communication may constitute general advice. It has been prepared without taking account of individual objectives, financial situation or needs and because of that you should, before acting on the advice, consider the appropriateness of the advice having regard to your personal objectives, financial situation and needs. MLC believes that the information contained in this communication is correct and that any estimates, opinions, conclusions or recommendations are reasonably held or made as at the time of compilation. However, no warranty is made as to the accuracy or reliability of this information (which may change without notice). MLC relies on third parties to provide certain information and is not responsible for its accuracy, nor is MLC liable for any loss arising from a person relying on information provided by third parties. Past performance is not a reliable indicator of future performance. This information is directed to and prepared for Australian residents only. MLC may use the services of NAB Group companies where it makes good business sense to do so and will benefit customers. Amounts paid for these services are always negotiated on an arm’s length basis.
Powered by WPeMatico
